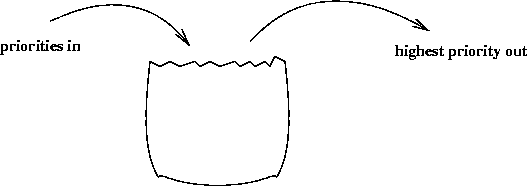
Profiling your Golang app in 3 steps
A 3 minutes story written on Nov 2018 by Adrian B.G.
This is a small intro to profiling Go apps or packages. To keep it short I will only focus on the computational optimizations (CPU). I presume you already know your way trough Go and bash.
Warning! Before optimizing be sure that your code is CPU bounded. If you make network calls, HDD scans or DB queries probably these improvements will have a very low impact on the overall performance of you app.
TL;TR
- profile benchmarks
- use speedscope.app
Step one — the project
If you do not have a project, you can clone one of mine.
Pseudoservice requires Go 1.11+ because it uses go modules.
$ git clone [email protected]:bgadrian/pseudoservice.git
$ cd pseudoservice
$ make
Step two — collect the data
We need a pprof CPU profile. There are a few ways to generate one:
a) Import the pprof package and start an web server
import _ "net/http/pprof"
go func() {
	log.Println(http.ListenAndServe("localhost:6060", nil))
}()
You will have to start your app, process some data (or whatever your app does), and then download the CPU profile by accessing http://localhost:6060. More on this in the pprof godoc.
You have to do this step in order to find the real bottleneck of your app. To not presume, always profile. After you find the flow/function that is consuming the most time make a benchmark for it.
b) Run only a benchmark. This is my favorite way because:
- it is simple
- pprof is included in all tests/benchmarks
- you can focus only a specific part of your project (less noise)
$ go test -bench=BenchmarkGenerateUsers300Deterministic -cpuprofile=profile300.gz ./handlers/*
If all goes well you will have a CPU profile in a gzip file: profile300.gz
Step three — view the data
There are multiple ways to view and investigate the collected data.
a) Using the pprof tool. It can generate text or image friendly reports from any profile. The most common example is a SVG chart like in the image:
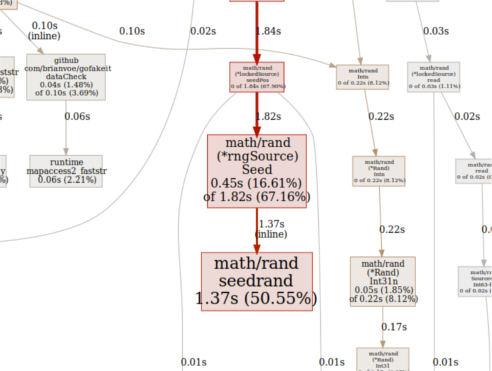
Type $ go tool pprof -svg profile300.gz See go tool pprof --help for more details.
b) Using FlameGraph is more complicated (to install), but the result is quite nice. I wrote a small snippet on how to install and use on github.
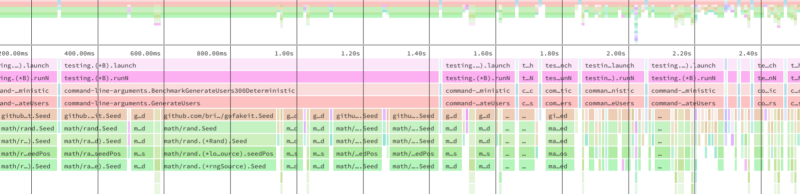
c) SpeedScope.app
The last and my (new) favorite way to visualize any profile is using this amazing, free, interactive flamegraph browser implementation.
Speedscope is a JavaScript app, an website that can also work offline. It has 3 modes:
- Ordered by time — here you can notice if one of the function calls misbehave. If you are familiar with other profiling tools like Chrome Dev Tools you already know about this mode.
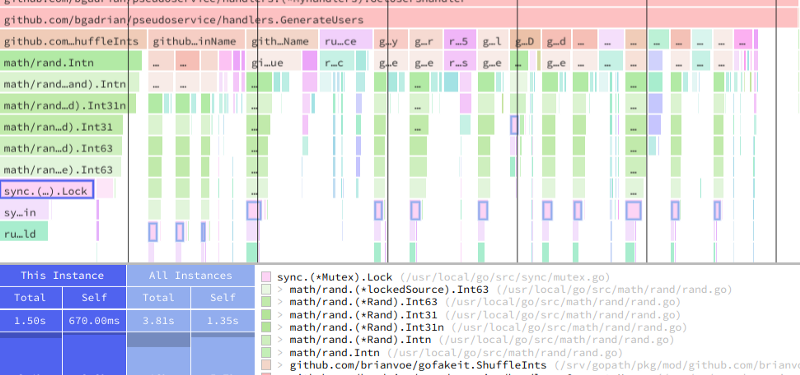
- Left heavy — here the data is aggregated, similar to the pprof SVG, you can easily spot the functions that consumed the most CPU cycles
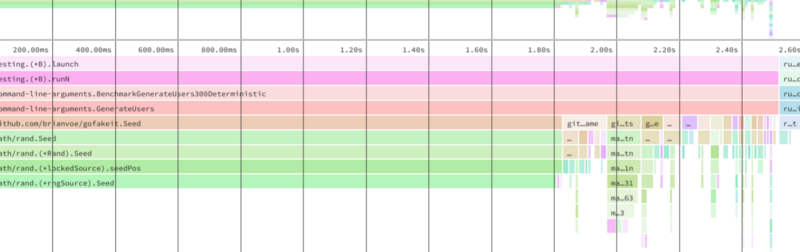
Here is another example where you can easily see that a Mutex is to blame:
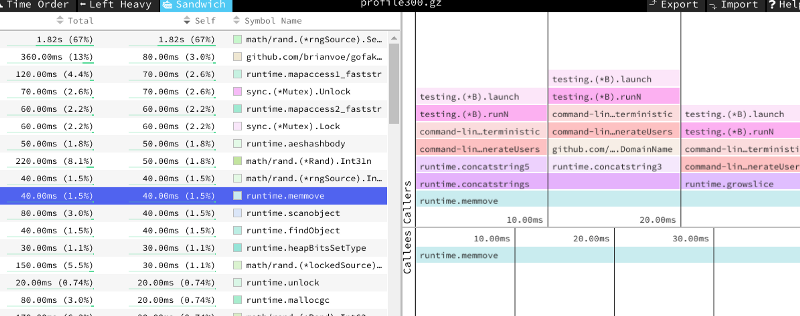
- Sandwich — another standard way to look at function calls, sorted by the total time it took to execute, from the total execution time or relative to its parent. This is a more text-based approach, good to spot patterns in the function names, like memory allocations or IO blockers.
Step four— fix it
If by examining your profiling data, resulted that you should and can improve your code go ahead, refactor it and repeat step 2. If you notice that the Garbage collector is hogging your app, you may want to do a Memory profiling as well.
When to stop optimizing? That is a good question. You stop when the ROI (return of investment) diminish and/or a more performance code will hurt other properties of your code like maintainability and readability.
Resources
The most comprehensive talk I’ve found on profiling Go code is: